Website ROI calculator
Your marketing brings them in. Your website lets them walk.
Small shifts in conversion rate create outsized gains for your business. Plug in your numbers and see what your site should be generating, and how much it's costing your business each month.
What a low-converting website costs you
An underperforming website costs your business in three ways
It's not just a few missed leads. The damage compounds across your business — your revenue, your marketing budget, and your position against competitors.
Revenue going to your competitors
Visitors who don't convert on your site don't disappear. They find the next option. If a competitor's site does a better job of building trust, they win the business you paid to attract.
Wasted marketing and ad spend
A site converting at 1% instead of 3% needs triple the traffic to hit the same revenue for your business. That's triple the ad budget and triple the content production — for the same result.
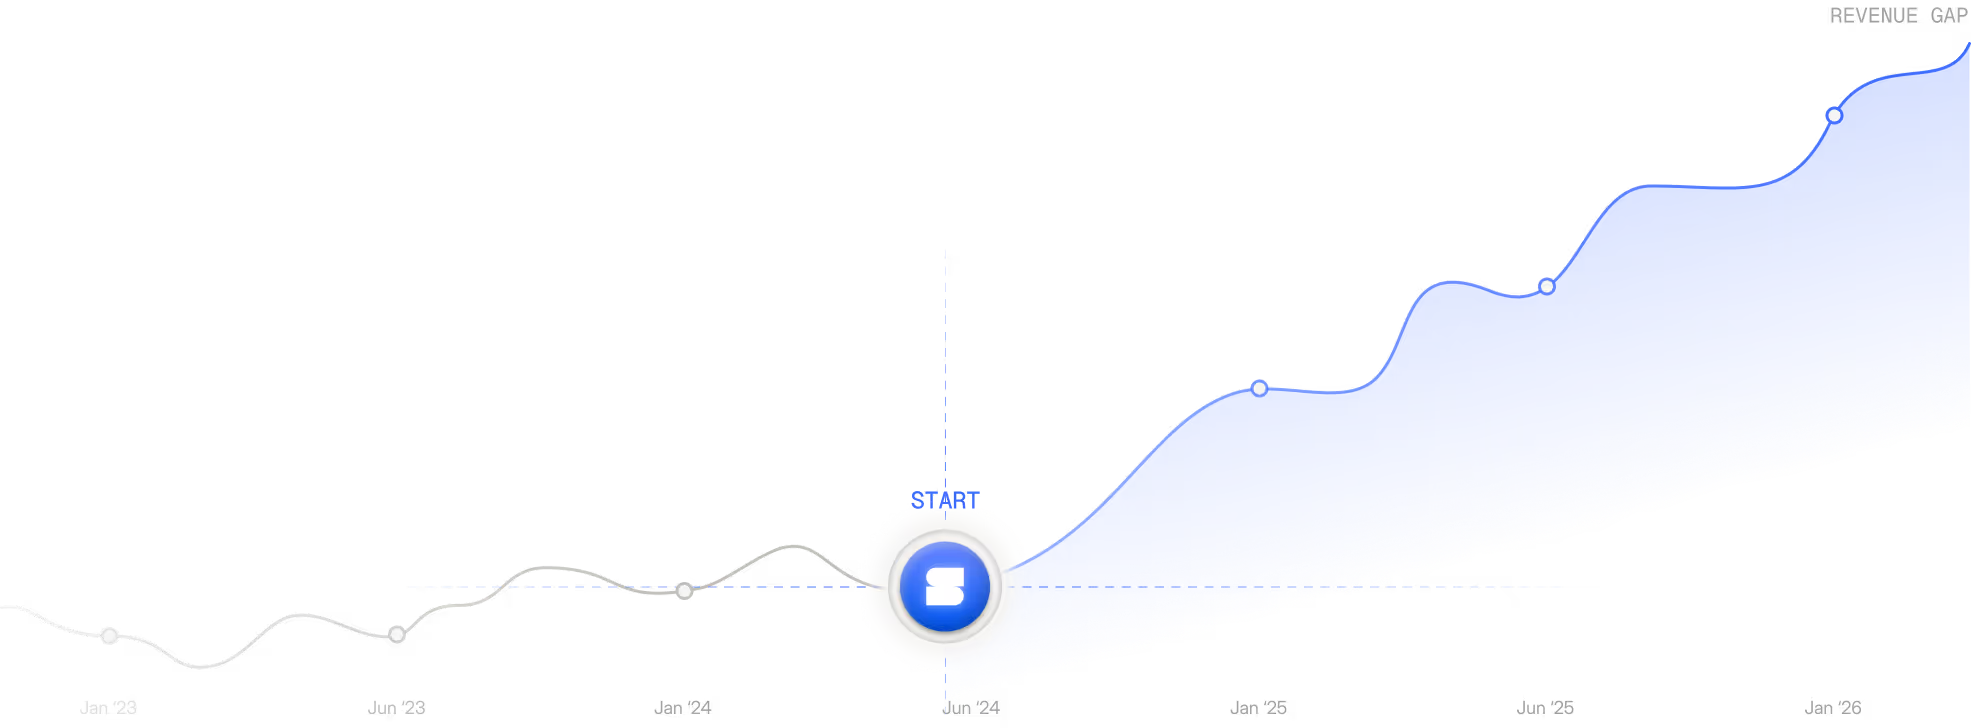
The gap compounds every month
This isn't a one-off loss. The difference between your current rate and a realistic improvement repeats every single month. Over a year, even a 1-point shift adds up to real money.
Put your numbers in the calculator
See what your website could be generating
Four inputs from your business, instant results. You'll see the gap between what your site generates today and what it could be generating with a better conversion rate.
Reading your results
Here's what your numbers are telling you
01
The revenue gap
This is what your business could be generating at a realistic conversion rate, minus what it brings in today. Based on first-deal revenue only.
02
The annual cost of inaction
That monthly gap, stretched over a year. For most B2B businesses, this number is many times larger than what a redesign actually costs.
03
Your marketing ROI and ROAS
If you're running paid ads on Meta, Google, YouTube, or LinkedIn, your conversion rate directly impacts your cost-per-lead and return on ad spend. Double your conversion rate and every campaign you run becomes twice as efficient — same budget, twice the leads.
These numbers are conservative, by design
The calculator shows first-deal value only. It doesn't include customer lifetime value, which for most B2B businesses is 3–5x the initial transaction. The real revenue impact is likely several multiples of what you see here.
A note on conversion rates — your traffic source matters
Your own data is the best starting point. But keep in mind that conversion rates vary significantly based on where your traffic comes from. Paid search visitors (actively looking for a solution) convert at a much higher rate than organic blog readers (researching a topic).
Example:
A B2B SaaS company getting 70% of traffic from paid search might convert at 3.5%. The same company with 70% organic blog traffic might sit at 1.2%. Both are normal for their traffic mix. If your traffic skews heavily toward one source, adjust expectations accordingly.
What drives conversion
Conversion rate isn't one thing you can fix with a quick tweak. It's several factors working together. When any of them break, your business feels it.
Clarity of your value proposition
Visitors decide to stay or leave within seconds. If your homepage doesn't answer "what, who, and why" immediately, nothing else on the site matters.
Trust signals and social proof
B2B buyers are risk-averse and spending company money. Logos, results-backed case studies, and well-placed testimonials reduce perceived risk faster than copy alone.
Friction in the conversion path
Long forms, buried CTAs, unclear next steps. Every extra click between interest and contact costs you conversions.
Copy and messaging quality
Design gets people to stay. Copy gets them to act. If your messaging talks about you instead of your buyer's problem, conversions suffer.
Page speed and performance
A page that takes 4+ seconds to load can lose 20–30% of visitors before they read a word. Mobile performance is even more critical.
Design quality as a credibility signal
Your site's design is a proxy for your business quality. Visitors judge it in milliseconds, before reading anything. Polish builds trust. Trust converts.
How we approach it
What your business gets
when you work with us
Now you know what moves the needle. The question is whether your next agency or partner will actually address all six. Here’s how we handle it.
Your strategy gets built before any design work starts
Every project kicks off with your market, your buyers, and your competitors. Your site gets structured around how your customers actually make decisions — not how your team talks about the business internally.
Premium design that signals quality
Your website sets the price expectation for your business. Polished, modern design builds authority and gives you the credibility to charge what you're worth.
Conversion-focused copy written for your specific buyers
Every line of copy is written to your buyers' problems, goals, and objections — grounded in real research into their world.
Lightning-fast performance, optimised for every device
Clean code, compressed assets, fast loads on every device. Your buyers research on their phones — your site performs there too.
100% custom-built on Webflow — no templates, no themes
No templates, no themes — every build starts from a blank canvas, structured around your buyers and your content. Your site looks like your brand, and no one else's.
Optimisation keeps going after you launch
Launch is where the real work starts. Headlines, CTAs, and page structure get refined based on what the data shows. Most businesses we work with see their strongest numbers 8–12 weeks in, not on day one.
COMMON QUESTIONS
Common Questions
About Website ROI
![Portrait of a Kevin D Chen [Dark]](https://cdn.prod.website-files.com/6963b46b73d13c416619d604/696770db31b454394fd4709a_43e4f0a4b187c1f51dd5024dd9980a60_kevin-photo.avif)
Kevin D. Chen
Founder & CEO
Can't find your answer?
We’ve gathered the most popular ones here. And if you’d like to ask us anything more specific, we’re here to help.
Review my website
Or email us on kelvin@superpresence.co
How accurate is this calculator?
What conversion rate should my business be aiming for?
I don't know my current conversion rate. Can I still use this?
How quickly do conversion rates improve after a redesign?
Can I improve my conversion rate without a full redesign?
Doesn't improving conversion rate need more than just design changes?
My business doesn't get much traffic. Does conversion rate still matter?
How much does a website redesign typically cost?
Your numbers tell a story.
Let's figure out what's behind them.
If the calculator showed a meaningful gap, it's worth 30 minutes to understand what's driving it and what realistic improvements look like for your business. No pitch, no pressure.
Fixed-price projects
No lock-in retainers
Transparent from day one